ggplot 특징
data + aesthetics (미학, 美學), → plot (geometry(기하학, 幾何學))
ggplot은 Leland Wilkinson의 저서 "The Grammar of Graphics"를 기반으로 Hadley Wickham이 개발한 R용 플로팅 라이브러리이다.
ggplot의 "gg"는 Grammar of Graphics를 의미하며, 컴퓨터에서 그래프를 그리는 과정을 문법 체계로 기술하였다.
ggplot은 모눈종이에 손으로 그래프를 그리는 과정과 동일하다고 생각하면 이해하기가 쉽다. (모눈종이는 영어로 graph paper이다.)
ggplot의 문법의 ggplot()'은 ggplot 객체를 초기화한다. 그래픽에 대한 입력 데이터 프레임을 선언하고 특별히 재정의되지 않는 한 모든 후속 레이어에서 공통적으로 사용되는 plot 미학(aesthetics) 세트를 지정하는 데 사용한다.
Pixabay로부터 입수된 mbnachhilfe_de님의 이미지입니다.
미학 : https://100.daum.net/encyclopedia/view/b08m1964b
미학
예술이란 인간의 활동 가운데 사물의 창조 등의 특수한 활동을 지시하며, 미는 진·선과 더불어 인간이 추구하는 많은 가치 가운데 하나이다. 미학이라는 학문은, 미가 진이나 선과 구별
100.daum.net
기하학 : https://100.daum.net/encyclopedia/view/b03g1277a
기하학
수학의 가장 오래 된 분야로 유클리드 등의 그리스인들이 확고한 기초를 세워 수세기 동안 유일한 기하학이라고 간주되었다. 1637년 데카르트는 유클리드 및 고전 기하학의 개념들을 일
100.daum.net
ggplot 구성
Graphics elements : data, aesthetics, geometry, coordinates, theme
Source : https://youtu.be/FdVy57oGJuc
ggplot (data, aes(x, y)) +
geom_FUNCTION (aes(color, fill)) +
coord_FUNCTION ( ) +
facet_FUNCTION ( ) +
scale_FUNCTION ( ) +
theme_*** ( )
예) coord_cartesian( xlim, ylim), coord_fixed( ratio, xlim, ylim)
예) ffacet_wrap( vars( vars_name), nrow, ncol), facet_grid( cols, rows )
예) scale_fill_manual ( ), scale_y_sqrt( ), scale_color_gradienth ( )
예) theme_gray( ), theme_classic(), theme_minimal()
ggplot2 Cheatsheet
Data visualization with ggplot2 :: Cheat Sheet
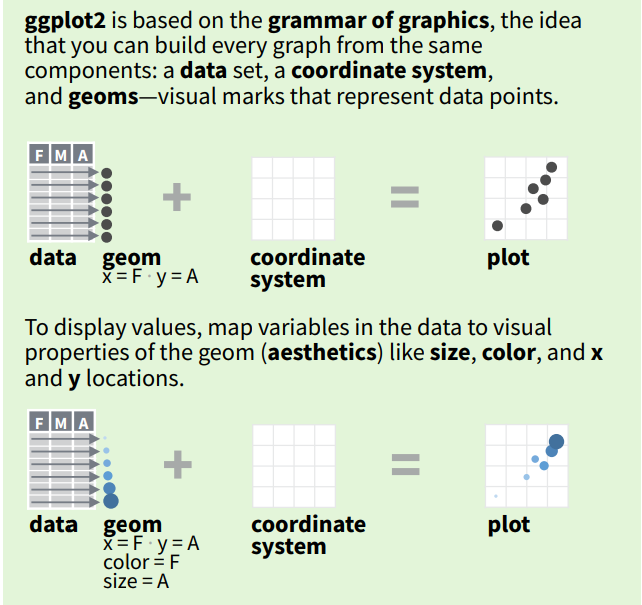
Basics ggplot2 is based on the grammar of graphics, the idea that you can build every graph from the same components: a data set, a coordinate system, and geoms—visual marks that represent data points. To display values, map variables in the data to visu
rstudio.github.io
Basics
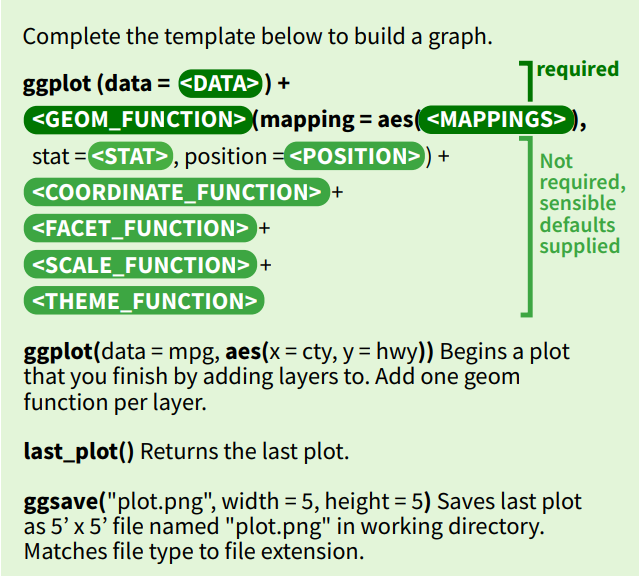
ggplot(data = <Data>) +
<Geom_Function>(mapping = aes(<Mappings>),
stat = <Stat>,
position = <Position>) +
<Coordinate_Function> +
<Facet_Function> +
<Scale_Function> +
<Theme_Function>
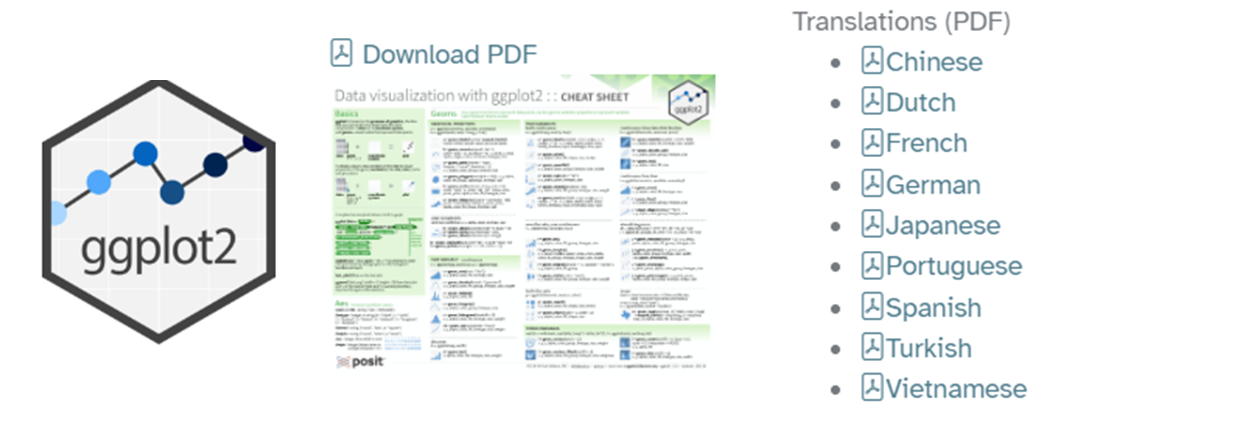

Cheetsheet가 영어, 독일어, 프랑스어, 스페인어, 포르투갈어 뿐만 아니라,
중국어, 네덜란드어, 일본어, 티르키예어, 베트남어도 있는데, 한국어가 없어서 아쉽다.
'데이터 분석 (with Rstudio)' 카테고리의 다른 글
| [Rstudio] Boxplot 박스플롯 (상자 수염 그림) with ggplot (1) | 2023.10.15 |
|---|---|
| [Rstudio] histogram 히스토그램 with ggplot (1) | 2023.10.10 |
| [Rstudio] 데이터 유형별 그래프 선택 기준 및 R 그래프 함수 (0) | 2023.10.09 |
| [Rstudio tidyverse] dplyr 패키지 (group_by, summarize, arrange) (1) | 2023.10.08 |
| [Rstudio tidyverse] dplyr 패키지 (filter, select, mutate) (1) | 2023.10.07 |


